PeopleScout UK Jobs Report Analysis — September 2018

The Office for National Statistics released its September Labour Market Bulletin which reports on May, June and July 2018. In those three months, 3,000 jobs were added to the UK economy with the unemployment rate holding steady at 4.0 per cent. The report shows that average weekly earnings for UK employees in nominal terms (that is, not adjusted for price inflation, minus bonuses) increased by 2.9 per cent over the last year.

UK Jobs Report Analysis — September 2018

The Numbers


3,000: The economy added 3,000 jobs over the May-July 2018 period.
4.0%: The unemployment rate remained unchanged from the previous quarter.
2.9%: Wages (excluding bonuses) increased 2.9 percent over the last year.

The Good


Wages rose faster than prices in the last three months, which beat analyst expectations. Wages, excluding bonuses, were up 2.9 per cent, against an inflation rate of 2.5 per cent, according to labour market statistics. The number of people working rose by 3,000 in the past three months to 32.4 million. Over the same time period, the number of job vacancies rose to 833,000. This is the highest number since these records began.


The number of unemployed people in Britain fell by 55,000 to 1.36 million, keeping the jobless rate at 4 per cent which is the lowest in more than 40 years.  Compared to the same time last year, 261,000 more people in the UK are working. Youth unemployment has declined to the lowest rate on record.

The Bad


Despite the recent wage growth, average weekly wages are still lower than the 2008 levels achieved before the financial crisis, remaining £31 below the pre-crisis average. The annual rate of growth in pay is still lower than the averages before the financial crisis when wages often rose by about 5 per cent.


Productivity also remains lower than pre-recession levels.  As Bloomberg reports:


“Without a significant improvement, firms may find their profit margins coming under pressure and increase prices to compensate. Flash figures for the second quarter show output per hour rose 0.4 per cent, leaving productivity up just 1.5 per cent on the year — below the rates enjoyed before the financial crisis.”

The Unknown


The relatively low number of jobs added may be an indication that the recent surge in jobs may have leveled off. Uncertainty over Brexit may be having an impact on workers who might otherwise move to new positions to increase their income.


Samuel Tombs, chief UK economist at Pantheon Macroeconomics, noted in the Guardian that while the strongest pay growth was among people moving jobs, workers may be increasingly opting to stay put while the risk lingered of no deal with the EU.“It would be a mistake to extrapolate the recent pickup in wage growth [into a trend],” he said.

PeopleScout U.S. Jobs Report Analysis — August 2018

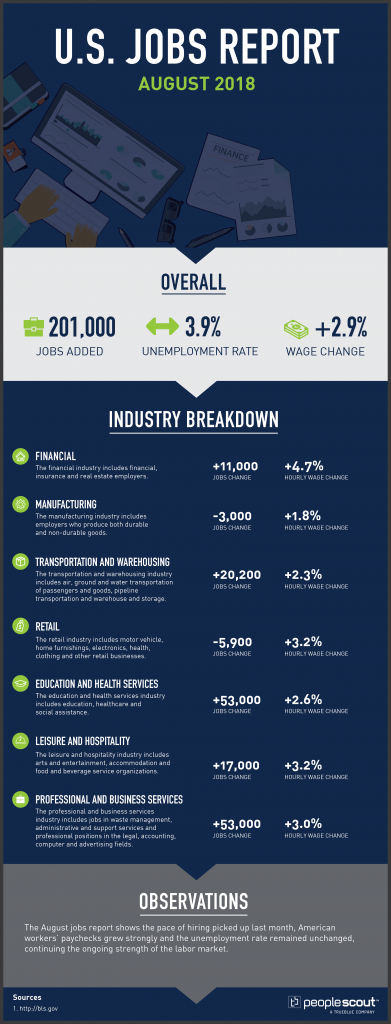
U.S. Jobs Report Analysis — August 2018

The Labor Department released its August jobs report which shows 201,000 jobs added to the U.S. economy. U.S. employers have added to payrolls for 95 straight months, extending the longest continuous jobs expansion on record. The unemployment rate remained steady at 3.9 percent.


The Numbers

201,000: The economy added 201,000 jobs in August.
3.9%: The unemployment remained at 3.9 percent.
2.9%: Wages increased 2.9 percent over the last year.

The Good

The 201,000 jobs added in August modestly beat analyst expectations. Average hourly earnings for all private-sector workers increased 10 cents last month to $27.16, a 2.9 percent increase from last August. This increase is the strongest year-over-year rise in earnings since the current expansion began in 2009. Over the past six months, 781,000 part-time workers have moved to full-time jobs.
Professional and business services added 53,000 jobs in August and 519,000 jobs over the year. The healthcare sector also had robust job gains with an addition of 33,000 positions in August and 301,000 since August 2017.

The Bad

The reason that the unemployment rate remained unchanged despite the job gains is that the labor participation rate dropped .02 percentage points from the previous month. This may indicate that there are limits for the tight job market to lure back those who have stayed out of the workforce.
While the loss of 3,000 manufacturing jobs in August may not be significant, most of these losses were in trade-affected industries like automobiles and transportation equipment. Without a resolution to the current trade disputes, the employment outlook in key manufacturing sectors is unclear and may have negative ripple effects in the nation’s industrial heartland.

The Unknown

It is not certain whether the decrease in the labor force will become a trend in the coming months. In 2008, more than 66 percent of adults were in the labor force which decreased to 62.7 percent in early 2015. This is the same level it fell to in August. A major factor is demographic change, with baby boomers hitting retirement age. It is uncertain whether a potential shortfall in workers can be addressed through immigration and automation.

PeopleScout Canada Jobs Report Analysis — August 2018

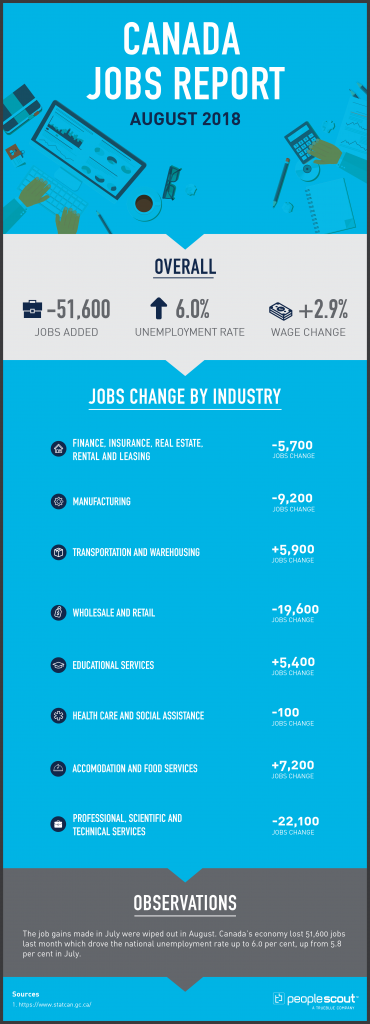
Canada Jobs Report Analysis — August 2018

Statistics Canada released its August 2018 Labour Force Survey which shows a loss of 51,600 jobs from the Canadian economy, driving the unemployment rate up to 6.0 per cent from 5.8 per cent in July. The loss of 92,000 part-time positions contributed to the drop.


The Numbers

-51,600: The economy lost 51,600 jobs in July.
6.0%: The unemployment rate rose to 6.0 per cent.
2.9%: Wages increased by 2.9 per cent over the last year.

The Good

Offsetting the loss of part-time jobs, full-time jobs rose by 40,400. For three provinces, the news was more positive than the nation as a whole. Employment in Alberta increased by 16,000, where the unemployment rate remained at 6.7 per cent because more people participated in the labour market.
In Manitoba, employment rose by 2,600, due to an increase in part-time work, and the unemployment rate was 5.8 per cent. While over the last year, employment in the province was unchanged, the unemployment rate increased 0.8 percentage points as the number of people looking for work increased in August. In British Columbia, employment edged up and the unemployment rate increased 0.3 percentage points to 5.3 per cent as more people in the province were brought into the labour market.
Compared to 12 months earlier, Canada’s overall employment is still up 0.9 per cent, following the addition of 171,700 jobs, including 326,100 full-time positions.

The Bad

The job losses in August wiped out the gains made in July. Ontario, Canada’s most populous province, lost 80,100 jobs last month after gaining 60,600 in July, both of which were almost entirely caused by volatile swings in part-time work. Ontario’s August decrease, a drop of 1.1 per cent, was by far the biggest decline among the provinces.
Average hourly wage growth continued its gradual slide in August to 2.9 per cent after increasing 3.2 per cent year over year in July and 3.6 per cent in June. The slowing of wage increases may create difficulties for Canadian employers who could see workers leave for jobs in other companies with the hope of substantial salary increases.

The Unknown

The result of the current intense negotiations between the U.S. and Canada regarding the future of the North American Free Trade Agreement or NAFTA may have a profound effect on the Canadian economy for years to come. Because the United States is Canada’s biggest trading partner, employers in the many sectors that depend on exports for profitability may hesitate to expand their workforce until a final agreement is reached.

PeopleScout UK Jobs Report Analysis — August 2018

The Office for National Statistics released its August Labour Market Bulletin which reports on the three months of April, May and June 2018. The bulletin reports 42,000 jobs added in the quarter and a decrease in the unemployment rate by 0.2 per cent from the previous quarter. The report is unchanged from last month in showing that average weekly earnings for employees in Great Britain in nominal terms (that is, not adjusted for price inflation, minus bonuses) increased by 2.7 per cent over the last year.

UK Jobs Report Analysis — August 2018

The Numbers

42,000: The economy added 42,000 jobs over the April-June 2018 period.
4.0%: The unemployment fell 0.2 percentage points from the previous quarter.
2.7%: Wages (excluding bonuses) increased 2.7 per cent over the last year.

The Good

UK unemployment fell by 65,000 to 1.36 million in three months of April, May and June – the lowest in more than 40 years. The unemployment rate has not been lower since December 1974 through February 1975.  Compared to one year ago, 313,000 more people are working in the UK. For people between 16- and 64-years old, 75.6 per cent are working, up from 75.1 per cent a year earlier. For women between 16-and 64-years old, 71.0 per cent are employed, up from 70.5 per cent a year earlier. The employment rate for men in the same age range, 80.1 per cent are working; the employment rate for men has not been higher since February to April 1991.

The Bad

The lackluster rate of wage increases may create challenges for employers who may see an increasing number of employees look for new jobs as the most direct path to raise their wages in a healthy job market. While the wage increase still outpaces inflation, there is doubt as to whether this will have a significant impact on the overall economy.

As Bloomberg notes:


“There remains precious little sign that wage growth is set to take-off – undermining a key assumption behind the Monetary Policy Committee’s recent decision to raise rates,” said Suren Thiru, head of economics at the British Chambers of Commerce. “The pace at which pay is exceeding price growth remains negligible, and is therefore unlikely to provide much respite to the financially squeezed consumer.”

The Unknown

The ONS figures show the number of European Union nationals working in the UK fell by a record amount. This decrease was the largest annual amount since records began in 1997 and continues a trend seen since the 2016 Brexit vote. This decrease contrasts with a rise in the number of non-EU nationals working in the UK to 1.27 million, which is 74,000 more than a year earlier. Without determining the status of EU nationals working in Britain after a final Brexit settlement, the composition of the UK labour force in both the near and long-term remains uncertain.

PeopleScout Canada Jobs Report Analysis — July 2018

Canada Jobs Report Analysis — July 2018

Statistics Canada released its July 2018 Labour Force Survey which shows 54,100 jobs added to the Canadian economy. That number impressively exceeded analyst expectations of 17,000. Unemployment fell by 0.2 percentage points to 5.8 per cent, a four-decade low. Wage growth slowed from previous months, and the bulk of the job growth came from part-time jobs.


The Numbers

54,100: The economy added 54,100 jobs in July.
5.8%: The unemployment rate fell to 5.8 per cent.
3.2%: Wages increased 3.2 percent over the last year.

The Good

Strong employment gains were made in major service-producing sectors including educational services; health care and social assistance; and information, culture and recreation. Over a one year period, employment grew by 246,000 (+1.3 per cent). These gains were largely the result of growth in full-time work (+211,000 or +1.4 per cent).
For the core-aged (25 to 54) population, employment increased by 35,000, boosted by gains among women (+30,000). The unemployment rate for women in this age group was down 0.3 percentage points to 4.9 per cent. Over a one year period, employment grew for both women (+72,000 or +1.2 per cent) and men (+41,000 or +0.6 per cent) in the core-aged group.

The Bad

According to the July report, Canada added 82,000 less desirable, part-time positions last month and lost 28,000 full-time jobs. The overall positive impact on the economy is diminished by the smaller income available to Canadian families than if the gains had been made in full-time positions.
The public sector made the biggest contribution to the July increase with 49,600 new jobs, while the private sector added only 5,200 positions. National Bank of Canada chief economist Stefane Marion wrote in a report Friday that the public sector is the “only game in town” so far in 2018. Marion’s research note was titled, “Where are the private sector jobs?”

The Unknown

Canadian analysts noted the mixed messages from July’s report. CTV News cited a research note from the Canadian Imperial Bank of Commerce, “In the wacky world of Canada’s monthly employment numbers, July came up with another head-scratcher, with some big headlines but some disappointments in the fine print,” CIBC chief economist Avery Shenfeld wrote Friday in a research note to clients.
Shenfeld added that there are “lots of reasons to question just how good the data really are here.”
Overall, he said the report contained a “good” set of numbers that will keep markets guessing whether the Bank of Canada will introduce its next interest rate hike in September or October. CIBC predicts the next rate increase will land in October as the central bank continues to proceed cautiously along its rate-hiking path.

PeopleScout U.S. Jobs Report Analysis — July 2018

U.S. Jobs Report Analysis — July 2018

The Labor Department released its July jobs report which shows 157,000 jobs added to the U.S. economy, continuing the longest stretch of job growth in the nation’s history. The unemployment rate fell 0.1 percentage points to 3.9 percent from the previous month.

The Numbers

157,000: The economy added 157,000 jobs in July.
3.9%: The unemployment rate fell to 3.9 percent.
2.7%: Wages increased 2.7 percent over the last year.

The Good

The July jobs report shows continuing and steady job growth. Although the increase in jobs last month came in slightly below expectations, figures for payroll increases in May and June were revised substantially higher. The Labor Department reported that the economy added 268,000 jobs in May, up from an initial estimate of 244,000, while the June gain was revised upward to 248,000 from 213,000.
Healthy expansion continued in key sectors of the economy including manufacturing with an annual increase of 327,000 jobs and business and professional services, which grew by 518,000 positions in the last year.

The Bad

The 2.7 percent annual increase in wages reported in July is not significantly different from the wage growth figures over the last two years. While the burden of major salary increases has not yet directly impacted employers, wage stagnation can create challenges in employee retention.  Wages have remained steady while the cost of living has increased for many Americans. For example, it is estimated that home prices are growing twice as fast as income growth.  In the current job market, candidates can be reasonably confident that there will another job waiting for them if they leave their current position. Because research shows that money is the top motivator for employees to quit their jobs, there is significant urgency for employers to have sound recruitment and retention programs in place.

The Unknown

The recently imposed tariffs on U.S. trading partners does not yet appear to have affected the domestic job market. However, threats of an all-out trade war with China may force employers to rein in hiring projections. It has been estimated that trade with China supports as many as 2.6 million U.S. jobs, and a sharp and sudden decrease in trade with China could have a significant negative impact on the U.S. economy.

PeopleScout Australia Jobs Report Analysis – June 2018

The Australia Bureau of Statistics released its June Labour Force Key Statistics. The increase in employment by 50,900 beat analyst expectations and is the strongest job growth since last November. Unlike May, the increase was led by full-time jobs. The unemployment rate held steady at 5.4 per cent, in part due to the increase in Australians participating in the labour force.

Australia Jobs Report Analysis – June 2018

The Numbers


50,900: The Australian economy added 50,900 jobs in June.
5.4%: The Australian unemployment rate remained at 5.4 per cent.
65.7%: Labour force participation increased to 65.5 per cent.
+6: According to the NAB, the business confidence index fell to +6 index points.

Upside


The net job gain of 50,900 in June continued the trend of monthly job growth. Since June 2017, full-time employment has increased by 158,200 and part-time employment has increased by 180,800.


The increase in the labour force participation rate can be explained by more Australians having confidence in finding a job. In seasonally adjusted terms, the largest increase in employment was in New South Wales (27,300), followed by Queensland (14,800).


The chief economist head of research, Asia-Pacific for ING noted the significance of the increase in full-time jobs in the Financial Times:


“Strong growth in full-time jobs in June helped to shift a labour market that was beginning to be dominated by part-time jobs. Our full-time equivalence measure suggests that labour demand is now picking up strength. Were this to also be reflected in some improved wages growth, it could radically change the outlook for the Reserve Bank of Australia, which most forecasters see on hold all this year, and possibly all of next year too.”

Downside


According to a study released in June by the Reserve Bank of Australia, the unemployment rate for people between 15- and 24-years-old in Australia is seven points higher than the national unemployment rate. Though this rate has historically been higher than for the rest of the population, Australia has an aging workforce. Businesses need to urgently address the challenge of attracting the right talent from the nation’s younger generation.

Unknown


An opinion piece in Bloomberg notes the shifts in Australia’s key relationships which could drastically impact its economy:


“The most significant are two related shifts. The first is changing relations between Australia’s biggest trading partner, China, and the guarantor of Australian security, the U.S. The second is the nature of Australia’s relationship with each of them. China’s growth is slowing, and its economy is driven less by investment and exports and more by domestic consumption. That means a waning appetite for the raw materials Australia sells it even as China’s economy grows bigger overall. And at some point, China may well have its own recession. Nothing lasts forever.”

How to Leverage Workforce Analytics and HR Data in Workforce Planning

According to a survey conducted by Harvard Business Review, 15 percent of respondents said they use “predictive analytics based on HR data and data from other sources within or outside the organization,” while 48 percent predicted they would be doing so in two years.

While organizations are increasingly incorporating data into the HR mix, there are still areas for improvement and to further adopt workforce analytics. Below, we outline some of the best practices for building an analytics-oriented workforce planning program along with some of the analytics processes essential for success.

Building an Analytics-Oriented HR Data Team

Organizations need to solicit input from a variety of stakeholders like talent acquisition program managers, human resource leaders, data specialists, budget and finance leaders and IT specialists to create a multidisciplinary team. When building your team, considering the following:

  • Does your organization have an individual with experience and expertise in data analysis with the leadership skills to manage a workforce analytics team?
  • Does the team you have assembled include analysts with data management, statistics and data visualization skills?
  • Do you have your IT department’s support to choose the right tools to integrate HR data with other data sources in the organization?
  • Can your team confidently present data-oriented solutions to senior leadership even if the solutions are counter to past workforce plans?

Collecting the Right Data

Collecting essential data points is a key step in a data-driven HR program. The data needed for analysis may come from multiple divisions within an organization. Organizations need to communicate the importance of sharing data with leaders organization-wide. Evaluating current internal HR data can help organizations identify future needs and draft a workforce strategy around them. Below is a list of data needed for workforce analytics.

Internal HR data:

  • What are the demographics of the current workforce? (Gender, ethnicity, disabilities, full/part-time, etc.)
  • How many people work in each position?
  • Where are positions located?
  • What is the employee to supervisor ratio?
  • What are the pay rates of current employees?
  • What is the likelihood of attrition through retirement?
  • What recruitment activities have been completed in the last two to three years?
  • What recruitment activities and resources were used?
  • How many qualified applicants were found?
  • Where did the most qualified applicants come from?
  • What do new employees think of your recruitment practices?
  • How many employees are needed to fill each position?
  • What knowledge, skills, competencies and abilities are needed to perform anticipated job functions?
  • What processes could be done more efficiently or effectively?
  • What are the organization’s strategic objectives?
  • What are the organization’s diversity objectives?

External Data Sources

Many organizations have inward-focused approach to workforce analytics and HR data and do not take into account what is going on outside the organization. The labor market is rapidly changing. Labor market data can inform organizations about talent supply in different locations and provide critical market intelligence on issues like competitiveness and salary range.

Data and job projection reports from the U.S. Department of Labor’s Bureau of Labor Statistics, for example, can lead to a better understanding of the supply and demand for essential occupations and the competitiveness of the job market.

Putting HR Data in Action  

Organizations should take the insights gained through workforce analytics initiatives and develop a workforce plan to fill the gaps between current and future hiring needs. Some strategies and considerations when drafting a data-oriented workforce plan include:

  • Plan for employees to receive skills training when needed to prepare for changing roles within the company.
  • Hire and retain employees with skills that are critical to the success of the business.
  • Create programs focused on employee retention.
  • Increase efficiencies in recruitment and hiring processes by proactively identifying vacancies through succession planning and forecasting future business requirements.
  • Identify training needs, classification and compensation issues, organizational or position changes that may affect employee retention.
  • Create workplace diversity strategies to reach organizational diversity goals.

Managing a Workforce Analytics Program and HR Data

Workforce analytics is a continuous process that is highly susceptible to changes in the economy and labor market. To stay on top of new developments, organizations need to ensure their workforce analytics process is managed properly. Below, we share advice on how to best manage a workforce analytics program.

Prioritize Business Goals

For workforce analytics to drive real value, it has to be aligned with an organization’s business goals. Everyone contributing to workforce analytics process needs to be briefed on the overarching business strategies, so they can understand how their analysis contributes.

Common workforce goals include:

  • Reduce turnover on a particular team or organization-wide
  • Retain high-performing individuals
  • Improve staffing and recruiting efficiency
  • Lower the cost of operations
  • Ensure the organization has talent aligned to expansion plans or planned new product offerings

Stakeholder Management

Because workforce analytics involve stakeholders from HR, finance, IT and others within an organization, clear and open communication should be emphasized early in the process. This will help stakeholders and their teams understand expectations up front and establish relationships between teams for success.

Data Quality

At the start of a workforce analytics initiative, it makes sense for organizations to conduct basic data hygiene practices like assessing the quality of data, gauging the need for data clean-up and documenting data-gathering and reporting processes.

Data Governance

Because employee data is personal, privacy rules must be respected. Proper data governance should be the responsibility of everyone involved in workforce analytics. However, someone should be assigned ownership to ensure that data and HR teams are following the processes established for data security.

Flexibility

Economic and business climates are not static; even the best workforce analytics program may miss emerging talent shortages or inadequately take certain contingencies into account. To make sure workforce analytics program reflect the latest internal and external developments, organizations should regularly re-calibrate and revise assumptions made from previous HR data analysis.

RPO Providers Can Assist Organizations with Workforce Planning, HR Data and Analytics

There is no one-size-fits-all workforce planning program, even for global organizations that have similar needs. What’s right for one organization may not be what another organization needs.

However, workforce planning does not have to be mysterious or complex. Organizations more than likely have a lot of the data they need, it is just a matter of creating the right management and reporting practices to interpret the data in meaningful ways.

The right RPO partner can help organizations make sense of their workforce analytics with their experience and deep understanding of labor market data and trends. An RPO partner can also work with an organization to create methodologies adapted to suit their needs. Click here to learn more about PeopleScout’s RPO solutions.

PeopleScout Canada Jobs Report Analysis — June 2018

Canada Jobs Report Analysis — June 2018

Statistics Canada released its June 2018 Labour Force Survey which shows 32,000 jobs added to the Canadian economy. While unemployment rose by 0.2 percentage points to 6.0 percent, this was due to an increase in job seekers.

The Numbers

32,000: The economy added 32,000 jobs in June.
6.0%: The unemployment rate rose to 6.0 percent.
3.6%: Wages increased 3.6 percent over the last year.

The Good

The 32,000 jobs added in June beat analyst expectations. Many of the gains were in important sectors like construction, manufacturing and natural resources. The rise in the unemployment rate is due to the addition of nearly 76,000 job seekers to the labour force which suggests that more Canadians are optimistic that they can find work due to the strong economy. Year-over-year wage growth is relatively strong at 3.6 percent.

The Bad

The aggregate job gain figures in June do not tell the whole story. Canada added only 9,100 full-time jobs in June and 22,700 part-time positions. The services sectors lost 14,700 jobs mostly because of big decreases in accommodation and food services positions. The wholesale and retail trade also had a significant decrease in jobs last month.
Additionally, the job gains only came from three provinces: Ontario, Saskatchewan and Manitoba. Everywhere else the market either shed jobs or remained flat.

The Unknown

Trade uncertainties with the U.S. cast the biggest shadow over economic forecasts for the coming months. NAFTA renegotiations dominate and undermine the outlook for the export sector. This is particularly important for the non-energy sector, which has already had several industries being subjected to tariffs this year.
Additionally, these numbers were released just days before the Bank of Canada’s decision on interest rates. Analysts expect that despite the trade concerns, employment and wage growth numbers are strong enough to prompt an increase in the benchmark.

PeopleScout U.S. Jobs Report Analysis — June 2018

The Labor Department released its June jobs report which shows 213,000 jobs added to the U.S. economy – continuing the longest stretch of job growth in the nation’s history. Increased participation in the labor market brought the unemployment rate up to 4.0 percent.

The Numbers

213,000: The economy added 213,000 jobs in June.
4.0%: The unemployment rate rose to 4.0 percent.
2.7%: Wages increased 2.7 percent over the last year.

The Good

The 213,000 jobs added in June beat analyst expectations. The rise in the unemployment rate by 0.2 percentage points is not bad news because it was caused by the increase in the workforce. Americans who have been sitting on the sidelines of the job market are being drawn in by the strong hiring environment.
Year over year job growth for many major sectors is impressive. In the last year, manufacturing has added 285,000 jobs; business and professional services increased by 521,000 jobs and employment in healthcare rose by 309,000.

The Bad

The tight labor market is having a negative impact on seasonal hires. The shortage of summer seasonal workers such as lifeguards is causing curtailing of services and higher wages, the cost of which may be passed onto consumers.
The U6, which is the unemployment measure that includes those too discouraged to look for work and workers in part-time jobs who want to work full-time, rose to 7.8 percent from 7.6 percent in May. The U-6 remains somewhat elevated compared to the last time unemployment was similarly low.

The Unknown

It is unclear how much the labor force can expand due to an aging population. With job openings continuing to increase, there is no clear path for how to attract those who have stayed outside the workforce in recent years.
While some hiring has been scaled back due to recently imposed tariffs and fears of a full-scale trade war, uncertainty remains regarding future commodity prices and inventory shortfalls which can have a profound effect on the nation’s economic health.