The Labor Department released its January 2020 jobs report
which shows that U.S. employers added 225,000 jobs in January, which beat analyst
expectations. The unemployment rose to 3.6%. The labor force participation rate
rose to 63.4%. Year-over-year wage growth increased to 3.1%. U.S. employers
have now added to the payrolls for 112 straight months, extending the longest
continuous jobs expansion on record.
The Numbers
225,000: The economy added 225,000 jobs in January.
3.6%: The unemployment rate rose to 3.6%.
3.1%: Average hourly wages increased at a rate of 3.1% over the last year.
The Good
The overall jobs numbers for January look strong. The 225,000
jobs added to the economy beat analyst expectations of just 160,000 in the first
month of 2020, according to CNN.
The growth was strongest in construction, healthcare and transportation and
warehousing. Some of that increase could be attributed to a warmer than average
January.
While an increasing unemployment rate can sometimes be seen as
a downside, in this report, it demonstrates that more sidelined workers are
being pulled into a strong economy. The Washington
Post reports that the labor participation rate hit a seven-year high of
63.4%.
The Bad
The strong hiring numbers in January didn’t apply across all industries. Manufacturing continued to lose jobs. Marketwatch reports that those losses were caused by the trade war with China. Jobs in retail also dropped.
Additionally, the January report included a few revisions
that decreased the number of jobs created in 2019. The overall employment level
for March 2019 was decreased by 514,000 jobs. For all of 2019, the number of
jobs added to the economy fell by 12,000 to 2.096 million jobs.
The Unknown
Despite strong job growth, the yearly wage growth remains lower than expected. The Wall Street Journal reports that the growing number of people reentering the workforce could be a factor in keeping the rate of wage growth from increasing more quickly. However, the cause of the persistently sluggish wage growth has been debated by economists for the past couple of years.
It is also still unclear what impact the coronavirus will
have on U.S. jobs numbers. The easing of the trade war with China was expected
to relieve some of the strain on the manufacturing industry. However, increasing
concern about the virus could impact that. The data used for the January report
was collected before news about the spread of the virus.
The shift toward global expansion is top of mind in many of today’s organizations, and for good reason: going global brings opportunities that may otherwise go untapped—such as new revenue sources, cultural diversification, economies of scale and greater access to talent. So, as your talent program grows, you may be considering expanding beyond your current borders.
Similar to traveling internationally, there are many steps to taking your business’ talent acquisition program global. As you plan for a trip abroad, you may make a packing checklist, get your passport and prepare accommodations. There’s anticipation as you near your trip date, and even some nerves as you take flight. You don’t quite know what to expect, but you’re excited about the possibilities of what you’ll discover. After an invigorating visit, you recount your trip and replay all you’ve experienced – good and bad. Global talent acquisition deployments are similar, and in this article, we’ll outline factors to consider throughout the different stages of implementation.
Choosing Your Global Talent Acquisition Deployment Type
The first item on any
traveler’s checklist is determining where to go. When it comes to global implementations,
get a good handle on the location or locations you’ll be expanding into before
taking off. After considering talent supply, cultural nuances and how easy (or
difficult!) it is to do business in a certain location, selecting a deployment
type should be straightforward.
There are two main types of global talent acquisition deployments:
“Big Bang” Approach: If you opt for this method, you’ll be launching all operations at one time on a singular date. This might be the choice for you if the main goal is compliance to global policies and procedures that align with a specific set of dates and standards.
Phased Approach: This type of deployment type favors a slower rollout of operations over time – which might be helpful for first-generation managed service provider (MSP), recruitment process outsourcing (RPO) or total workforce solutions programs that you want your organization to ease into.
Factors to Consider
After choosing a travel destination, you’ll start looking into the details of the location you’re visiting. What’s the weather like? What language do people speak? Where are the best food spots in town? In essence, seemingly small aspects tend to have large effects on the success of your trip. Likewise, once you’ve taken all of the initial expansion considerations into account, you’re better equipped to further assess pivotal factors that will greatly influence the success of the overall deployment, including the following significant global and local influencers.
Key Stakeholder Identification & Support Capacity
It’s crucial to align
organizational expansion plans with regional cultural norms and any specific
local nuances. For example, when initially organizing the details, are there
any types of communication styles that are considered rude or offensive? This
is crucial to ascertain for positive program adoption from the start. Also, be
sure to frame that local focus to stakeholders, as opposed to communicating a
message that essentially states that a new program will be laid over local
operations. Stress the fact that you’ll be interweaving existing operations
with new features and benefits to ensure maximum success for the program and
all involved.
Additionally, focus on ensuring that all voices are heard—from local teams to individual hiring managers—to avoid any passive resistance; you’ll want to fully understand how people work in that particular location and what day-to-day norms mean to ensure the success of the program. Try putting yourself in the shoes of the end-user; a seemingly simple concept like shadowing can go a long way in showing the local constituency that you’re invested in the success of the program at their specific location.
Availability of Talent
We’re currently seeing low unemployment rates paired with skills shortages across the globe—a trend we haven’t seen consistently in the past. Because of this, consider shifting your focus to soft skills when it comes to assessing the talent landscape in a given region. This means concentrating on skills like critical thinking, problem solving and adaptability to new environments. No matter whether you’re introducing a new industry to the area, carefully decipher what the competition for talent looks like. From there, you can start developing a well-thought-out sourcing plan to align the resources necessary for a successful deployment.
Change Management and Global Talent Acquisition
When done right, change management can have the greatest effect on deployment success. A critical component of managing change in global talent acquisition implementations is gaining buy-in from key, local stakeholders. Then, you can depend on these stakeholders to translate (literally and figuratively), the feedback needed to take into consideration.
Another vital part of
managing change is ensuring the right amount of frequency to ensure consistent
alignment. Rather than one initial message followed by
months of silence leading up to the “go-live” communication, consider a layering approach. Keep communications frequent, consistent and to the point to get
people excited about what’s coming and interested in what the changes mean for
them.
And, as important as it is to keep communication
consistent as you prepare for launch, it’s just as critical post-launch. Reinforce
the benefits people should be seeing, ensuring everyone is comfortable with the
changes and collecting feedback around any training or functionality that may
need revisiting. A high level of communication and comfort translates into
successful program adoption.
When it comes to talent technology, several different factors need to be considered. For an MSP program, the main component is the vendor management system (VMS). Along the same lines, with an RPO program, you’ll be focused on the applicant tracking system (ATS) and any other systems that may need to be integrated for either or both. Similar systems may be utilized across an organization with varying local versions, so it’s important to understand what consistencies exist, as well as gaps that need to be addressed.
Ensure the pros and cons
are carefully weighed across the systems the technology will interface with,
then try to choose one as a “source of truth” for compliance, data validation
and data integrity. In doing so, you’ll see consistency across the talent
technology, giving you a true, holistic view of the workforce when it comes to
analytics and reporting.
Finance & Tax
What’s important here –
and heavily dependent upon the workforce population at hand – is ensuring that there
is clear visibility and guidance around cross-border implications, such as
supplier and provider payments, global and statutory requirements, or
arrangements in which a hiring manager sits in a different location than the
resource. This becomes especially important when there is an integration with
an invoicing system and effects on back-office operations.
The Stages of a Global Talent Acquisition Launch
After months of preparation,
you’re finally leaving for your much-anticipated trip. You just have to check
in to your flight, print your boarding pass and you’re on your way! After a
two-week experience you’ll never forget, you return home to tell your friends
and family every detail of your getaway (even down to the hotel mishap on night
three). Your global deployment will go through similar stages, as outlined
below.
Pre-launch
At the pre-launch stage,
all stakeholders should have a good working knowledge of what’s coming and
when, and you should have a good sense of how everyone is feeling. Are people
comfortable with what’s coming? Are they ready for it? What needs to be
adjusted now based on the feedback collected?
Ensure that all technology
components are operating as planned, and that enough time has been dedicated to
testing different scenarios that will be realized upon launch. The quickest way
to do this is by running through predetermined scripts and observing how the
technology responds. If time allows, some organizations also subscribe to a
“break the system” approach by trying out every possible or one-off scenario –
including erroneous field data – to assess the outcome. While this takes more
time, it also tends to be the most thorough, especially if multiple
technologies are at play.
Successful Launch
When it comes to executing
a successful launch, the biggest components are represented above. As you
progress in the implementation, it’s wise to consistently refine change
management, calibrate resource alignment and pivot as needed, so as not to lose
momentum as progress is made. Remember to share successes along the way, and
not to lose sight of the overall goals of the program.
Furthermore, whether you’re evolving your program or expanding into additional locations, consider the overall maturity of the labor market market and generation of the program you’re launching. For instance, if this is a second-generation program, what do you need to consider from the first launch and potentially change? It’s also important to communicate the fact that unexpected issues may arise and, if they do, it’s critical to address these obstacles transparently.
Post Launch
Once the program expansion
has launched, consider the following recommendations:
Dedicate
time to complete a thorough audit:
Assess how well the goals were met, taking into account that they may have
changed over time.
Schedule
a “lessons learned” meeting:
Identify and capitalize on best practices acquired throughout the launch.
Check
in at all levels of the operation:
Work to understand what is and isn’t working.
As data starts coming in
regularly, analyze for trends that may not have been visible before to determine
any adjustments that need to be made related to resources, processes or technology.
After any trip, you spend some time at home reliving the experience and getting reassimilated with your day-to-day life. You think about what you did and didn’t like, go over what you learned, and naturally decide whether you want to take another trip. Maybe the destination was so great that you want to go back, or perhaps you’re ready for something new. Global talent acquisition implementations are similar, and whether you’ve met your needs with one deployment or are planning for further expansion, the right talent partner can help take you there.
Finding the Right Partner
Choosing a partner to help you through your global talent acquisition deployment is like choosing an airline. Are they reputable? Dependable? Can they get you where you need to be? Most important, can you trust them with your bags? When you’re looking into viable partners to work with for your implementation, ask yourself:
Do they
align with our business needs?
Will
they deliver value across every level of the organization?
Are they
flexible?
Do they
have any proven standards?
Do they
have the ability and experience to tailor operations as needed?
Don’t be shy about asking your potential talent partner to prove their value. Request case studies and demonstrated expertise that illustrates that they have the experience you’re looking for. Finding a partner that is a good fit for your organization is a huge undertaking and you want to make sure you get it right. You’ll likely be working with them for a long period of time, and the success of your implementation will depend on the strength of your relationship and the trust you have in your partner.
Statistics Canada reported
that the nation’s unemployment fell to 5.6%. In December, the economy added 35,000
jobs, beating analyst expectations. The total number of jobs added in Canada in
2019 was 320,000. Average weekly wages increased 3.7% on an annual basis. Ontario,
Quebec, Manitoba and Prince Edward Island all posted job gains, while declines
were recorded in Newfoundland and Labrador.
The Numbers
35,000: The economy gained 35,000 jobs in December.
5.6%: The unemployment rate fell to 5.6%.
3.7%: Weekly wages increased 3.7% over the last year.
The Good
Statistics Canada reported that 35,000 jobs were added to the national economy in December, which in great part reversed the losses recorded in November. In 2019, employment increased by 320,000 or 1.7%. This was primarily due to gains in full-time work which grew by 283,000 or 1.9%. In contrast to the United States, Canada added more jobs in 2019 than in 2018.
From an annual perspective, Ontario, Canada’s most populous province was a clear winner in job growth. Employment in Ontario increased 243,000, an impressive 3.3%. This was the largest year-over-year increase measured in December since 1987, and the growth was driven by full-time jobs in a range of industries. Quebec also posted healthy gains in 2019 adding 63,000 positions growing 1.5% over the year and was driven by full-time work. The strongest gains were from the two groups at opposite ends of the age spectrum, youth aged 15 and 24 and people aged 55 and over.
Weekly wage growth dipped in the final report of the decade on an annual basis, but it is still one and a half percentage points higher than the rate of inflation. Canada ended the year and the decade on a positive note with unemployment dropping three-tenths of a percentage point to 3.6%.
The Bad
At 3.6%, Canada’s unemployment rate was the same in December 2019 as it was in December 2018. In May, the unemployment rate dipped to 5.4% which was a record low since the start of comparable record-keeping in 1976. The ensuing months produced uneven results which disappointed observers hoping for an extended period of historic low unemployment.
While the job gains in December were generally considered strong, they did not completely make up for the November losses. In addition, the strongest sectors for job gains was in accommodations and food service and in construction. While an increase in construction jobs in the midst of winter is considered to be a positive indicator, growth in foodservice and the hotel sector may be short-term since they are closely tied to the holiday season. Even the robust growth in Ontario posted losses in one troubled sector, posting losses for jobs in manufacturing. Most other large provinces had little significant change in their job levels in 2019.
Wage growth, while still strong,
has been fluctuating throughout the year so there is no clear trend that has
been established. Annual pay increases at the hourly level in some key sectors
of the Canadian economy were well below that national rate of 3.6%. For
example, the increase in the sales and services sector, stood at 2.6% in
December, a full percentage point below the national figure.
Future Job Growth: Geography as Destiny?
Over the past year, Ontario accounted for 76% of Canada’s job growth. Based on last year’s numbers, almost all job increases are taking place east of Manitoba. However, when viewed on a provincial basis, these numbers can be misleading. It is instructive to look at some local growth rates to get a more accurate picture. While British Columbia’s job market may be stagnant, Abbotsford and Victoria were ranked third and fourth, on BMO’s ranking of cities with the strongest job markets. Alberta’s relatively sluggish job market is contrasted with Calgary which added 3.3% new jobs last year, vastly outpacing the national rate.
And despite the surface
geographical contrasts, the variance between the best-performing and
worst-performing parts of the country is narrowing. As BMO’s senior economist Robert
Kavcic notes,
“job convergence is taking place all over Canada.” Canadian employers should
look beyond the headlines to assess the accurate jobs situation in their
markets and sectors as they plan their strategies for recruitment and retention
in the rapidly evolving labour environment.
The Labor Department released its December 2019 jobs
report which shows that U.S. employers added 145,000 jobs in December,
which was below analyst expectations. The unemployment rate remained at 3.5%. The
labor force participation rate was also unchanged at 63.2%. Year-over-year wage
growth slipped to 2.9%. U.S. employers have added to payrolls for 111 straight
months, extending the longest continuous jobs expansion on record.
The Numbers
145,000: The economy added 145,000 jobs in December.
3.5%: The unemployment rate held at 3.5%.
2.9%: Average hourly wages increased at a rate of 2.9% over the last year.
The Good
The final jobs report of the
decade showed another month of solid job growth. The average monthly gains for
the last three months of 2019 were 184,000, which is close to the quarterly
averages earlier in the year. In the last year, 2.1 million jobs were added,
which is more than sufficient to keep up with the demands of population growth.
There were notable monthly increases in the retail sector with 41,200 jobs
added, in healthcare which was up by 28,000 and in leisure and hospitality
which grew by 40,000.
From an annual perspective, many
key sectors recorded job growth or were little changed. Growth in healthcare was especially
impressive. The sector added 399,000 jobs in 2019, increasing by 49,000 more
positions than in 2018. Even some industries which experienced setbacks over
the course of the year posted modest gains overall in 2019. Manufacturing grew
by 46,000, and retail jobs increased by 9,000.
The year began with an
unemployment rate of 4.0% in January and ended at a 50-year low of 3.5%. Significantly,
an alternative measure of unemployment which captures those underemployed and
marginally attached to the workforce known as the U-6, fell to 6.7% in December,
the lowest on record going back to 1994.
The Bad
The December report confirmed that
a decade of robust job growth ended with a notable slow-down. The 2.11 million
jobs added last year was a drop from the 2.68 million added in 2018, and 2019
was ranked eighth
for job growth in the past 10 years. With the exceptions of healthcare and leisure
and hospitality, most key sectors added significantly fewer jobs in 2019 than
in 2018. The transportation and warehousing sector which is closely tied to the
overall economic health of both the nation and the world, added just 57,000
jobs in 2019, approximately one-fourth of the 2018 gain of 216,000.
The labor participation rate at
63.2% remained steady. However, this rate is still below the levels posted
before the Great Recession. The stall in participation may indicate that no
matter how low the unemployment rate falls, additional Americans who are out of
the labor force are not being drawn back into it. Some economists have
suggested that an underlying reason for this is the changing age demographics of
the United States due to its low birth rate and aging
population. This trend is not expected to change anytime soon.
Instead of posting strong wage
gains at a time of historic low unemployment, the rate of growth actually
decreased in December. While the 2.9% annual wage increase is still ahead of an
inflation rate of just less than 1.5%,
workers in many sectors are having their wages grow at a rate much lower than
the national average.
Easier to Get a Job Than a Raise
As Diane Swonk, chief economist at Grant Thornton noted: “It’s easier to get a job than a raise in this economy.” While some employers may benefit from attracting those who are seeking a new job due to their stunted paychecks, they may be just as likely to lose talent for the same reason. Adding to the challenge of extremely low unemployment, the most recent jobs opening report showed an increase in vacancies which continues to be higher than those who are unemployed.
The closing
months of 2019 also brought to a close a decade of strong economic growth and
robust labor markets for many of the world’s leading economies. However, the
disruption caused by trade disputes and uncertainties have produced the first
signals that this long period of sustained expansion may be coming to an end.
Among the unresolved issues that continue to affect the global economy are:
The
U.S.-Mexico-Canada trade agreement, which was negotiated to replace NAFTA, has
yet to be ratified by the legislature of all three nations. Author’s note: There may be a vote in the
U.S. Congress in the coming weeks after a deal was struck by the Democratic
leadership and the White House.
The
ongoing trade war between the U.S. and China, the world’s two largest economies,
continues and may continue into 2020.
Uncertainty
over Brexit continued until the UK election on December 11, which very likely
cleared the way for its departure from the European Union. Even with a firm
Brexit date, a final trade agreement with the European Union has yet to be
completed, and negotiations will be closely watched.
While job growth continued unabated in the labor markets of many key economies, the growth came at a slower pace than in 2018. Some of the most developed economies saw the period of sustained job growth halted and some unemployment rates began to climb. In addition to trade uncertainty, political upheaval and natural disasters also had negative effects on important economies in far-flung parts of the world.
Slowing Job Gains & Job Losses Materialize in the Labor Market
The U.S. labor market added 266,000 jobs in November and posted an unemployment rate of 3.5%. November’s results capped 110 months of continuous job growth, the longest period of sustained expansion in the nation’s history. The year began with an unemployment rate of 4% in January, which was the highest level all year. After hitting a half-century low of 3.5% in September, the unemployment rate rose slightly in October, only to come down to tie the fifty-year record level of 3.5%. While job openings steadily decreased to approximately 7 million, this level of openings was still larger than the number of unemployed Americans.
Additionally, the average monthly job growth improved to 180,000 per month in the 12 months leading up to November 2019. However, at the same time last year, the monthly average of jobs created was 223,000. So, while the job market was expanding, it did so at a slower pace than it did in 2018. The sectors that lost some jobs or grew at an anemic rate include manufacturing and retail. And, while manufacturing was disrupted by strikes and ongoing trade disputes, the diminishing jobs in retail were largely caused by the growth in online shopping, which has brought about a so-called “retail apocalypse” in the U.S. and elsewhere.
Canada’s employment numbers were positive in much of the first half of the year and grew worse as the year wore on. After losing less than 2,000 positions in October, Canada’s economy shed 71,200 openings in a single month in November. While more than half of those (45,000) were lost in Quebec, other provinces also lost jobs and none had any notable job gains. Canada’s unemployment jumped 0.4% in November alone, reaching 5.9%. From a national perspective, the weak job outlook was not confined to manufacturing and retail as it was in the U.S.; although these were certainly weak in Canada, as well, it also extended to most major sectors of Canada’s economy.
In Europe, the economic landscape was mixed, with most major labor markets posting low unemployment rates that varied little from earlier in the year. In the UK, 58,000 jobs were lost in the quarter ending in September 2019. This was the second consecutive report with posted job losses, many of which analysts blamed on the uncertainty surrounding Brexit. However, the quarter ending in October showed a modest job increase of 24,000 positions, pushing employment to its highest level ever. Yet, even in the months when employment fell, the unemployment rate also dropped to a low 3.8%, which held steady in the August-October quarter; the UK unemployment rate has not been lower since 1974, well before the living memory of much of the UK workforce. And, while the results of the December national election opened the path for a departure from the European Union in early 2020, provisions of an eventual trade agreement between the UK and the EU remain to be seen.
Elsewhere in
Europe, the Eurozone’s unemployment rate was 7.5% in October, the same as it
was in June, but 0.3% lower than it was at the end of the first quarter. France
posted an unemployment rate of 8.5%, falling from 8.7% in June, while Germany’s
low unemployment rate of 3.1% in October was unchanged from its level in June.
In the Asia-Pacific region, unemployment rates rose in some leading labor markets, but only to relatively low levels. During the third quarter, China’s labor market reported an unemployment rate of 3.6%, a full percentage point higher than in the second quarter. Japan’s rate rose just 0.1% from June to October, landing at 2.4%. After experiencing considerable unrest, Hong Kong’s unemployment rate rose to 3.1% in October – from just 2.8% in June. And, in contrast with the rise in unemployment in other Asian powerhouses, South Korea’s unemployment rate fell an entire percentage point from June to October, ending at 3%. India’s labor market also had a drop in unemployment, falling 0.4% since June, to 7.5%.
The Oceania economies also posted mixed unemployment numbers from their respective labor markets. Australian unemployment was just 4.9% in February, an eight-year low, but it has been higher ever since, rising to 5.3% in October. New Zealand reported that its unemployment rate had fallen to 3.9% in the second quarter of this year – down from 4.3% at the end of 2018 – but then rose to 4.2% in the third quarter.
Wage Increases Outpace Inflation in Key Labor Markets
Annual wages have continued to grow faster than the rate of inflation in most leading economies. The U.S. annual wage increases stood at 3.1% in November, coupled with an inflation rate of less than 2% in the third quarter. In the UK labor market, nominal annual wages rose 3.5% in the quarter spanning August through October, which was also comfortably ahead of inflation. During the same period last year, nominal wages increased 3.3% annually, and the unemployment rate was 0.3% higher. Both the U.S. and UK posted higher annual wage gains earlier in the year, but the increases were not substantial relative to the tight labor markets in each country during much of the year. There is no clear consensus among economists as to why wages have not risen faster during the current sustained period of low unemployment.
In the Canadian labor market, annual wage gains fluctuated sharply during 2019; in May, they were just 2.1%, rising in July to 4.6%, but falling to 3.8% in September before landing back at 4.5% in November. This rising rate of wage increases came during the same month that Canada experienced its greatest job loss since the financial crisis.
Australia
instituted the highest minimum wage law in the world on July
1, 2019, but annual wage growth continued to be sluggish; year-over-year wage
growth fell to just 2.2% in November, and Australian wage increases have been
stagnant for some time. The last time the annual rate of increase was just 1%
higher was in late 2012. And, without the robust minimum wage introduced earlier
this year, wages could have potentially grown even more slowly. With
unemployment above 5% for most of the year, analysts are not predicting
significant wage gains until the labor market improves.
Political Unrest & Devastating Fires
Massive street
demonstrations erupted in Hong Kong and in capitals around Latin America during
the closing months of 2019, leading to significant economic costs. The capitals
of Bolivia, Chile and Ecuador were roiled by anti-government protests. Specifically,
Chile – which is considered by many to be an economic success story – had a
3.4% annual retraction in its economy in October, which was triggered by its civil unrest. As a result, the
government agreed to a referendum to replace the constitution, and announced
plans for a $5.5 billion economic stimulus package.
Similarly, protests in Hong Kong intensified after months of ongoing demonstrations and led to a shutdown of the city’s airport; traffic was also disrupted and major thoroughfares turned into sites of violent confrontations. The effects of the protests on Hong Kong’s economy have been devastating. In the retail sector alone, 7,000 firms are expected to close, and many of those that survive plan to lay off employees. Moreover, the government is forecasting a contraction of 1.3% for Hong Kong’s economy in 2019 – the first annual decline since the Great Recession in 2009.
Furthermore, powerful wildfires broke out in both California and Australia, causing extensive destruction and exacting economic costs in their respective economies. Workers in Sydney and other areas close to the fires struggled with smoke-filled air and, consequently, concerns for their personal health and safety. Meanwhile, in California, fires changed the landscapes of entire communities, and power was regularly cut off as a preventive measure to keep the fires from spreading.
The relentless threat of new wildfires and the intensity of the destruction of this year’s infernos have led some to conclude that the seemingly endless potential for prosperity in the nation’s largest state is over, and that this is the end of California as we know it. The fires in both places led to dislocations and business interruptions. While political unrest will inevitably fluctuate and appear in different locations around the world, destructive fires in both the western U.S. and Australia have become the new normal, and will likely continue to be a factor in the affected regions in the years to come.
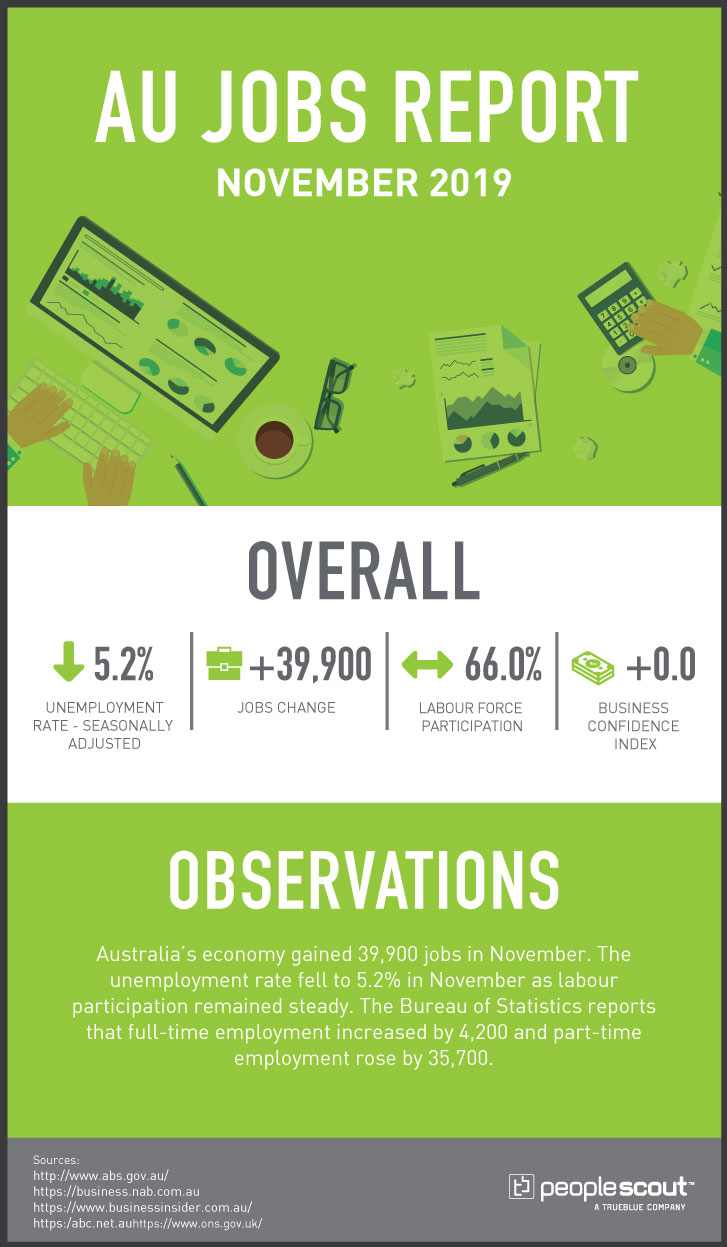
Australia’s economy gained 39,900 jobs in November. The
unemployment rate fell to 5.2% in November as labour participation remained
steady. The Bureau
of Statistics reports that full-time employment increased by 4,200 and
part-time employment rose by 35,700.
Numbers
+39,900: The
Australian economy gained 39,900 jobs in November.
5.2%: Australian unemployment fell to 5.2%.
66.0%: Labour
force participation was steady at 66.0%.
0: The Business Confidence
Index fell to 0 in the latest NAB
release.
Upside
The 39,900 jobs added in November were a welcome reversal of the job loss experienced in October. The number of unemployed Australians decreased by 16,800 to 708,100 people. Over the last year, full-time employment increased by 144,700, and part-time employment rose by 110,200. The job gains last month helped push the unemployment rate down one-tenth of a percentage point to 5.2%. While the participation rate remained stable at 66.0%, it is at a near record-high level. In another sign of progress, monthly hours worked in all jobs increased by 2.9 million hours in November.
In seasonally adjusted terms, the largest increases in
employment were in Queensland (up 17,300) and Victoria (up 13,700). Some states
also had jumps in their participation rates which indicates that more of their
residents are being attracted into the workforce. The participation rate
increased by 0.5% in Tasmania to 61.1%, 0.3% in Queensland to 66.2% (which is
higher than the national rate) and in South Australia which grew by 0.2% to
62.9%.
Downside
Part-time job gains greatly outnumbered those in full-time
employment. Only 4,200 full-time jobs were added compared to an increase of
35,700 in part-time work. The only job decrease was in New South Wales, the
nation’s largest state by population which shed 2,800 positions. The seasonally
adjusted participation rate there also decreased by 0.2%, falling to 65.3%.
The modest reversal in job growth has not inspired many economists to express optimism regarding Australia’s near-term economic outlook with some predicting a rise in unemployment next year. Capital Economics analyst Marcel Thieliant pointed to the fall in employment advertising as a sign that November’s job growth will likely be reversed: “The continued fall in job advertisements suggests that unemployment will climb further,” he predicted. “What’s more, households’ unemployment expectations are consistent with the unemployment rate rising to 5.5% by mid-2020.”
His sentiment was echoed by others including Indeed’s
economist Callam Pickering who noted that the Australian labour market is
showing “signs of fatigue” with an unemployment rate that has been continuously
higher than the 4.9% level posted in early 2019.
Closing the Skills Gap: Implications for Employers
While some economists are expressing concern over future job
growth, many Australian workers appear to be concerned that they do not have
the right skills to succeed in the jobs that will be available. A recent study
by Centre for the New Workforce at Swinburne University of Technology, in
partnership with YouGov, sought to reveal how Australian workers are preparing for
the future of work which includes factors like digital transformation,
artificial intelligence and automation. Their findings include:
61% of Australian workers don’t think that their
current skill set is suited for the next five years of work. This is a jump
from 56% in just one year.
Key motivators for Australian workers include
learning more and being stimulated by their work. In response to what inspires
them most about their jobs 46% selected ‘the nature of the work itself’ and 34%
chose ‘opportunity to learn and grow.’
For the main barriers to learning at work, 56%
responded ‘not having dedicated time for learning’ and 39% cited ‘unsupportive
working environment where learning is stigmatised.’
51%
of Australian workers spend less than one hour a week at work on learning in
any form which includes 20% who state that they have no learning at all on
their jobs.
The results of the study show that Australian workers are
both concerned about their skill levels meeting future demand and not having
the time or supportive environment to acquire the skills that will help them
succeed. In order to retain their valuable workforce, employers should
effectively communicate the learning opportunities that are currently available
and develop these programs to include the skills that are anticipated to be
needed in the future. It is also important to structure the work environment
and scheduling to support continuous and effective learning. A successful
learning programme can also be an important tool in attracting talent and can
be featured as part of a sourcing effort and building an employer brand. Enterprises
can effectively leverage their employee development and learning programmes to
support retention and recruitment by partnering with a recruitment process outsourcer which
can share its experience and expertise on how to maximize the impact of an
enterprise’s investment in the learning and growth of its workforce.
The December Labour Market Report released by the Office for National Statistics, which includes the three month period covering August through October 2019, reported that 24,000 jobs were gained as the unemployment rate held at 3.8%.
Notable figures from the December report include:
The UK
employment rate was estimated at 76.2%, 0.4 percentage points higher than a
year earlier but with very little change over the previous quarter. Despite
just reaching a new record high, the employment rate has had only small
fluctuations over the last few quarters.
The UK
unemployment rate was estimated at 3.8%, 0.3 percentage points lower than a
year earlier but largely unchanged over the previous quarter.
Estimated
annual growth in average weekly earnings for employees slowed to 3.2% for total
pay (including bonuses) and 3.5% for regular pay.
Slight Job Gains after Consecutive Losses and Continued Low Unemployment
The 24,000 new jobs were welcome news after consecutive
reports posting more than 100,000 job losses. The gains, while modest, beat
analyst expectations, with one poll of
economists predicting a median loss of 10,000 jobs. One particularly
encouraging data point was an increase of 8,000 jobs in manufacturing, although
a new study
showed that a recent downturn in manufacturing output could have serious
repercussions for the UK economy overall.
The unemployment rate continues to be very low at 3.8%. It
has not been lower since the final quarter of 1974, well before the living memory
of much of the nation’s workforce. The UK economic inactivity rate was
estimated at 20.8%, 0.2 percentage points lower than a year earlier but mostly
unchanged over the previous quarter. The inactivity rate includes those in
their prime working years who have not been seeking work within the last four weeks
and/or unable to start work in the next two weeks.
The modest job gains and recent losses are viewed by some
economists as part of a trend of diminished growth in employment compared to
recent years. While uncertainty over Brexit may have played a role, employers
have also faced challenges finding talent with the right skills for their open
positions. As Tej
Parikh, chief economist at the Institute of Directors, noted,
“The UK’s jobs boom continues to be a big plus point for the economy, but
it is slowly losing momentum. Businesses have shown a strong appetite to take
on staff in recent years, and climbing employment levels have boosted household
incomes, adding buoyancy to the economy. However, firms are now cutting back on
new hires as it becomes harder to find the skills they need.”
Steady Decrease in Job Vacancies and Wage Growth Outpacing Inflation
The number of job vacancies has been dropping since early
2019. For the September to November 2019 period, there were an estimated
794,000 vacancies in the UK—20,000 fewer than for the previous quarter (June to
August 2019) and 59,000 fewer than the previous year. (Job vacancies in the UK
are reported over a three-month period beginning one month later than the other
major labour market estimates.) While the fall in job vacancies has coincided
with a drop in the unemployment rate, a continuing downward trend in open
positions could have the adverse effect of discouraging additional workers to
join the nation’s workforce next year.
The rate of annual pay growth reached 3.9% in the May-July
2019 period and was the highest nominal pay growth rate since 2008. In the August
to October period, it dropped to 3.5%. While the annual pay increases are still
well above the rate of inflation, there is no evidence future strong rate
increases which have emerged in the past during times of very low unemployment.
Shifting Talent Pool
The period of the labour market report released today ended in October, more than a month before the national referendum, the results of which greatly increased the probability of Brexit on January 31, 2020. However, even while there was uncertainty over whether an exit from the European Union would ever come to pass, some striking migration figures began to emerge. The Office for National Statistics reported last month that net migration from the EU to the UK fell to its lowest level since 2003. In November, more than 140,000 EU citizens applied to live and work in the UK after Brexit adding to a backlog of more than 360,000 applications from those who are still waiting for a decision. At the same time, the level of non-EU migrants into the UK is reaching near record highs.
The volatile and fast-changing availability of talent from abroad adds to the already challenging conditions of extremely low unemployment faced by UK employers. Because of uncertain environment, partnering with experts in both the evolving talent market and employee acquisition such as a recruitment process outsourcer in the months to come may never have been more important as a factor to an enterprise’s success than in the year to come.
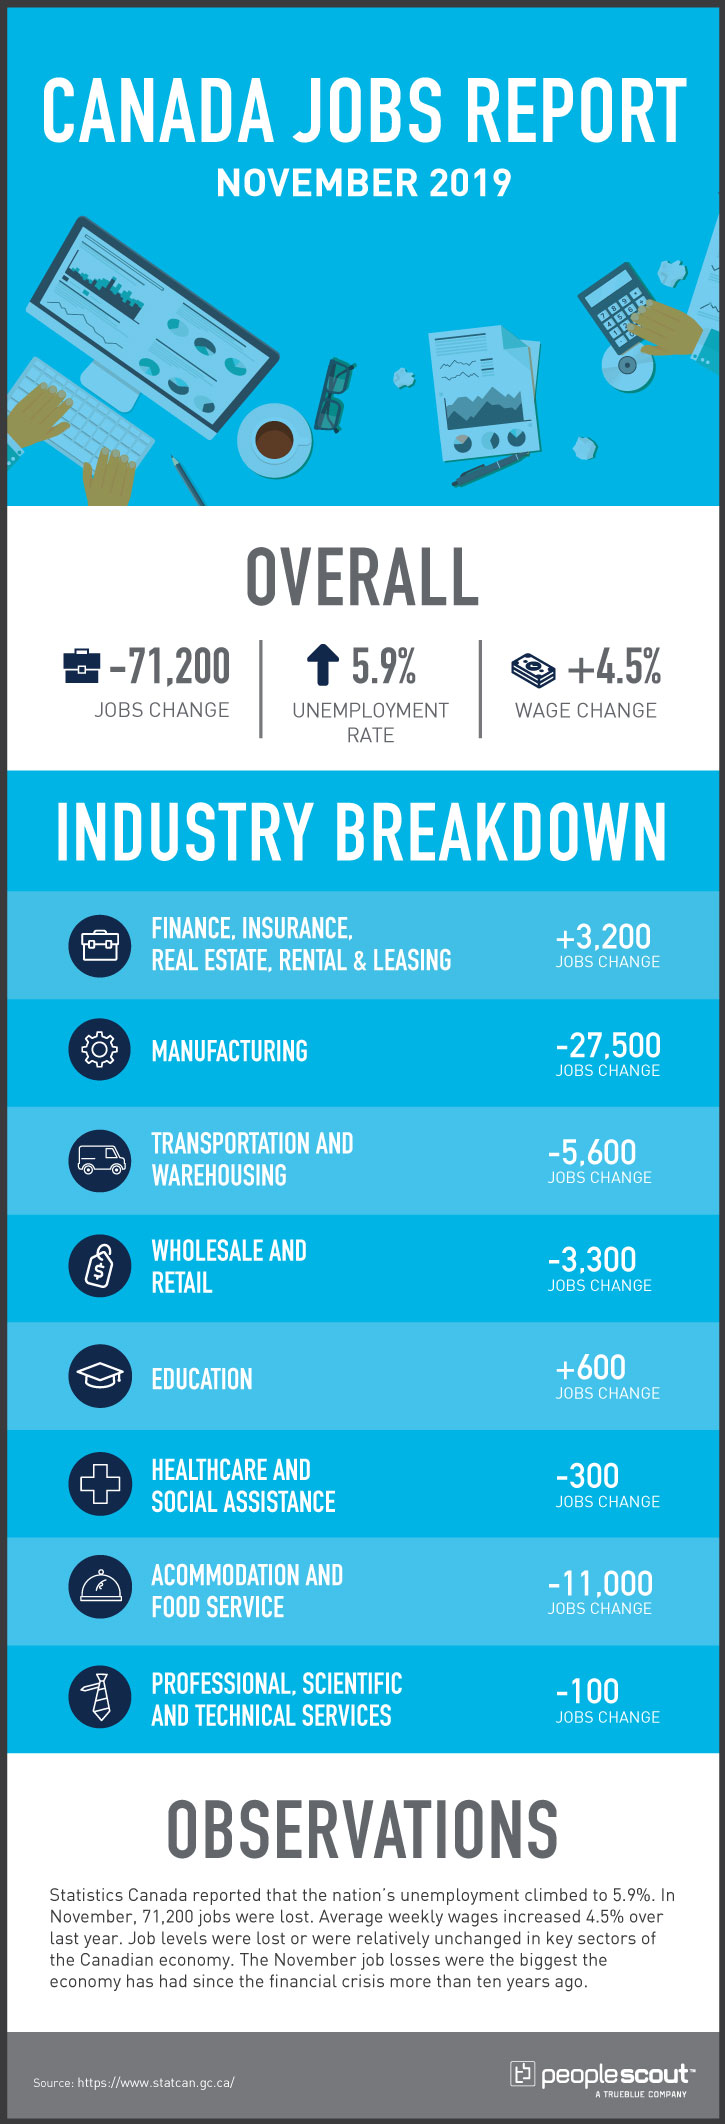
Statistics Canada reported
that the nation’s unemployment climbed to 5.9%. In November, 71,200 jobs were lost.
Average weekly wages increased 4.5% over last year. Job levels were lost or
were relatively unchanged in key sectors of the Canadian economy. The November
job losses were the biggest the economy has had since the financial crisis more
than ten years ago.
The Numbers
71,200: The economy lost 71,200 jobs in November.
5.9%: The unemployment rate rose to 5.9%.
4.5%: Weekly wages increased 4.5% over the last year.
The Good
Statistics Canada reported that strong wage growth continued in November with average weekly wages increasing by 4.5% over twelve months. When viewed from an annual growth perspective, employment gains since November last year totaled 293,000 (+1.6%), with the increase largely accounted for by full-time work. Over the same period, total hours worked also grew by 0.2%.
While the job-loss numbers are significant, 20,000 of those jobs were due to the ending of temporary employment related to the recently completed federal elections.
The Bad
Canada experienced its worst job loss in November since the Great Recession. Jobs were shed in both goods-producing industries and the service sector.
In the goods-producing sector, fewer people worked in manufacturing which dropped by 28,000 positions and in natural resources (-6,500), with the bulk of the declines in each of these industries happened in Quebec. On an annual basis, Canada-wide employment in manufacturing was little changed, but it has declined in natural resources (-25,000 or -7.2%), mostly in Alberta and British Columbia. Job losses in the services-producing sector were led by those in public administration, where the number of workers fell by 25,000 in November.
Quebec was the hardest hit
province in November where 45,000 fewer people were employed in November. This
decline is primarily attributable to manufacturing and the accommodation and
food services sector. Since more people looked for work in the province while
jobs were dropping, the unemployment rate in the province increased by 0.6
percentage points to 5.6%.
Employment in Alberta fell by
18,000 in November, with declines happening in a number of sectors led by
wholesale and retail trade. With more people seeking work, the unemployment
rate in Alberta rose by 0.5 percentage points to 7.2% last month. Employment in
British Columbia fell by 18,000 in November, with the losses spread across
several industries. The unemployment rate rose to 5.0% in November from 4.7% in
October.
Even in those provinces where the job markets did not have significant losses, unemployment rates rose. While employment in Ontario held steady in November, the unemployment rate increased by 0.3 percentage points to 5.6% as a result of more people looking for jobs. Employment in Saskatchewan was little changed, while the unemployment rate rose to 5.8% (+0.7 percentage points) as more people looked for work. There was also little employment change in Manitoba, and the unemployment rate edged up 0.3 percentage points to 5.6% in November.
The jobs report was seen by some analysts as shedding light on long-term weak spots in the Canadian economy, especially in manufacturing. Josh Nye, Senior Economist at RBC noted that there has been a steady decline in manufacturing jobs and that with ongoing trade uncertainty, there is no sign of recovery in the near future:
“That decline is pretty
eye-catching. It’s one of the bigger stories. It’s one of the weaker industries
if you’re tracking employment growth year-to-date, down an average 4,000 per
month. Manufacturing has been weak globally this year. You’ve got rising trade
tensions between the world’s two largest economies and slowing global growth
that’s really been concentrated in the industrial sector.
Broadly speaking this is a
sector that hasn’t generated much in the way of job growth for a number of
years now so it’s hard to see that narrative changing in 2020.”
Canadian Career-Changers are
Happier for Doing So. Could They Also be an Untapped Source of Talent?
The majority of Canadians who have switched careers say that they are happier because of their decision to do so according to a recent poll by Indeed Canada. Those who have been recently downsized or are otherwise concerned about their employment outlook or career future may choose to search for work outside their current field.
Almost nine out of 10 Canadians who have made a career change say they’re happier since switching career paths. Researchers polled 1,023 randomly selected full-time workers from a range of industries as well as education levels and found that 38% of them had made a complete career change at some point. Of the respondents, 35% said they were either currently thinking about switching careers or have thought about doing so. Of those respondents who have made a career change, 87% said they are happier since making the change.
Two important elements had to be
a part of these Canadian’s successful career transformations. First, the person making the career switch
had to possess the skills to begin a new career or be ready and able to acquire
them. Second, the employers who hired them had to have a broad view of their
new employee’s potential to succeed, even if they have not had a matching job
description in the past.
Rather than limit candidate sourcing to those in a given career category, employers can broaden their search to include those with different professional backgrounds that may be motivated to change careers and could be attracted to their job offerings. Identifying these individuals, especially for hard-to-fill positions in challenging markets needs the expertise and experience which is not always found in human resources departments that may already be stretched to the limit in their talent acquisition efforts. For this reason, it is a good idea to partner with a recruitment process outsourcing company with the knowledge and skills that can lead to the successful onboarding of those individuals from a wide range of career paths.
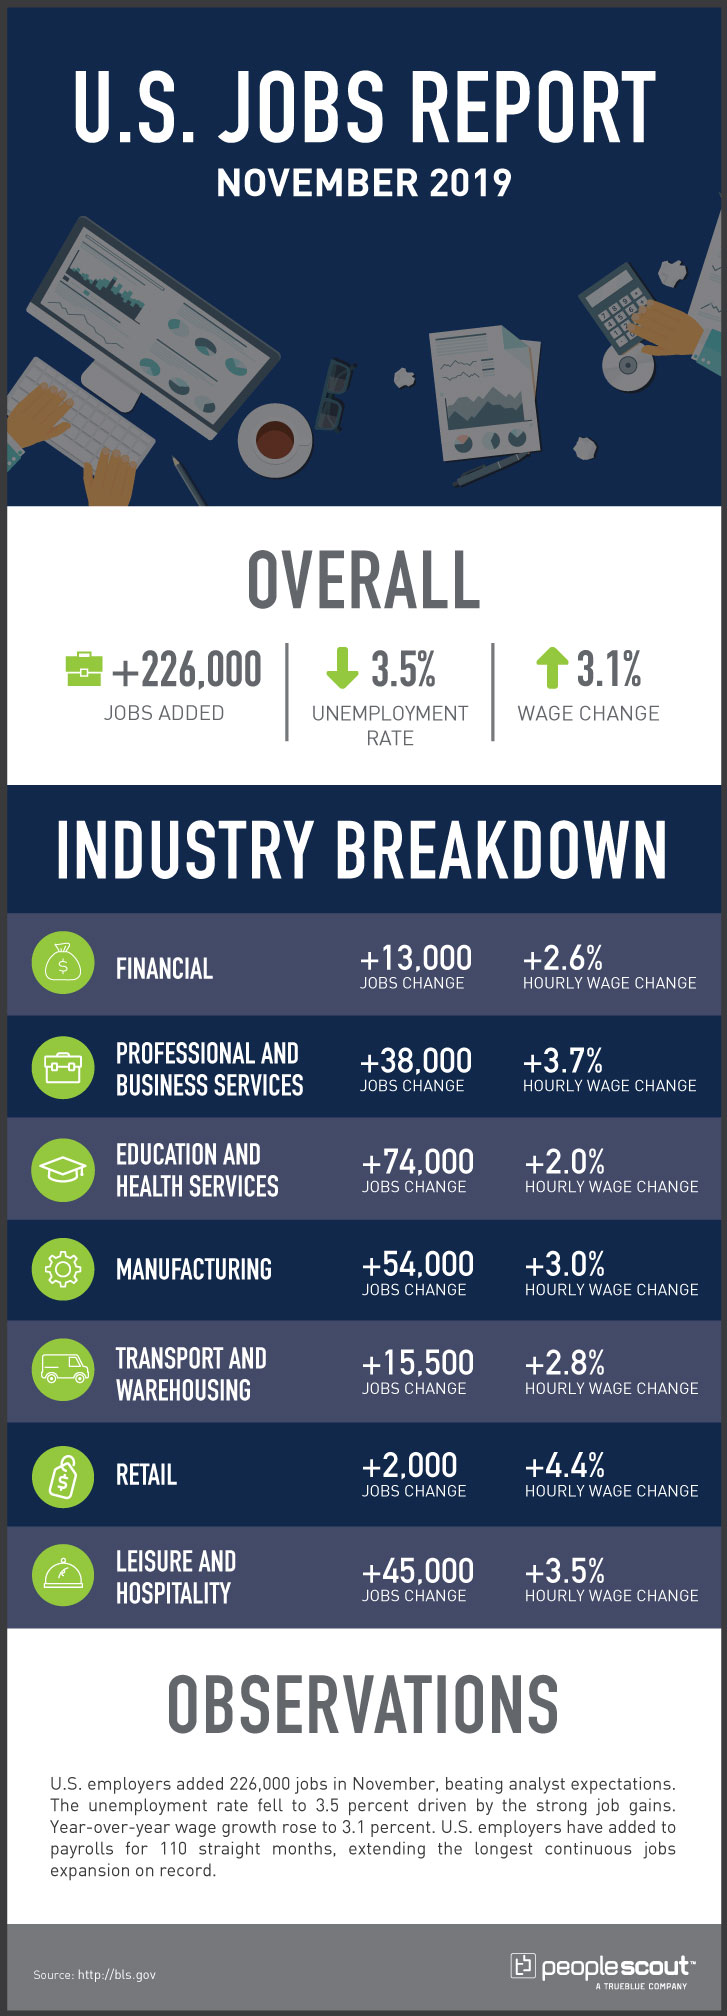
The Labor Department released its November jobs report which shows that U.S. employers added 266,000 jobs
in November, beating analyst expectations. The unemployment rate fell to 3.5%, a 0.1% decrease from last month. The
rate’s decrease was caused by strong job growth with little change to the labor
participation rate. Year-over-year wage growth rose 0.1 percentage points to 3.1%.
U.S. employers have added to payrolls for 110 straight months, extending the
longest continuous jobs expansion on record.
The Numbers
266,000: The economy added 266,000 jobs in November.
3.5%: The unemployment rate fell to 3.5%.
3.1%: Average
hourly wages increased at a rate of 3.1% over the last year.
The Good
Reporting on the drop in
unemployment and annual wage growth that is well ahead of the inflation may
have been overshadowed by the robust (and
unexpected) job growth last month. The monthly increase was the best since
January’s 312,000 and well ahead of the November 2018 total of 196,000. November’s
strong job expansion was fueled by gains in several key sectors. There were
45,000 health care jobs added with a jump in ambulatory health care services
(up 34,000) and in hospitals (up 10,000). Over the last year, 414,000 health
care jobs have been added to the U.S. economy.
Employment in professional and technical services rose by 31,000 in November and by 278,000 over the last year. Employment in leisure and hospitality continued to grow, adding 45,000 positions last month and a total of 219,000 jobs in just the last four months. Even the embattled retail sector showed modest job growth (up 2,000) which reflected rising employment in general merchandise stores (up 22,000) and in motor vehicle and parts dealers (up 8,000).
The Bad
Some of the sector job gains are
not as strong as they initially appear. The increase in retail jobs was offset
by a loss of 18,000 positions in clothing and clothing accessories stores
during the month that kicked off the traditional Christmas shopping season. While
manufacturing gained 54,000 jobs last month following a decline of 43,000 in
October, 41,000 of these were in auto manufacturing generated by thousands of
General Motors workers who were returning to work after being on strike.
Despite the strong monthly report, job growth has averaged 180,000 per month this year compared with an average monthly gain of 223,000 in 2018. While the job market is expanding, it is doing so at a slower pace than last year. The most recent BLS report on U.S. job openings showed that they have fallen to their lowest level in a year and a half. While the number of jobs grew last month, the number of those employed part-time for economic reasons, which was reported as 4.3 million people, changed little in November. These individuals, who would have preferred full-time employment, were working part-time because their hours had been reduced or they were unable to find full-time jobs. Despite strong demand, employers were unable to significantly attract those in this category into the full-time workforce.
Plan for Continuing Tight Labor Markets
The November jobs report was perceived by many as demonstrating the continuing strength of the U.S. economy, despite ongoing concerns over the impact of tariffs and trade disputes. As the new year approaches, it is noteworthy that this is the first decade in which the U.S. has not experienced a major recession since the 19th century. Even as job openings fall, the number is still larger than the number of unemployed Americans. Fears of a recession being on the horizon are fading for some analysts.
As the economy grows, so does the demand for talent and businesses are planning for growth. For example, in the small business sector which has been a major driver of job growth, approximately 60% of the 654 employers surveyed in November said they planned to expand their headcount in 2020 and just 4% were planning cuts.
While employers need to consider
an array of directions the economy may take next year in their workforce
planning, the optimism generated by the November jobs report indicates that
expertise in both attracting and retaining talent will continue to be as
crucial to the success of an enterprise in the coming years as it has been in
the prosperous decade which is about to end.
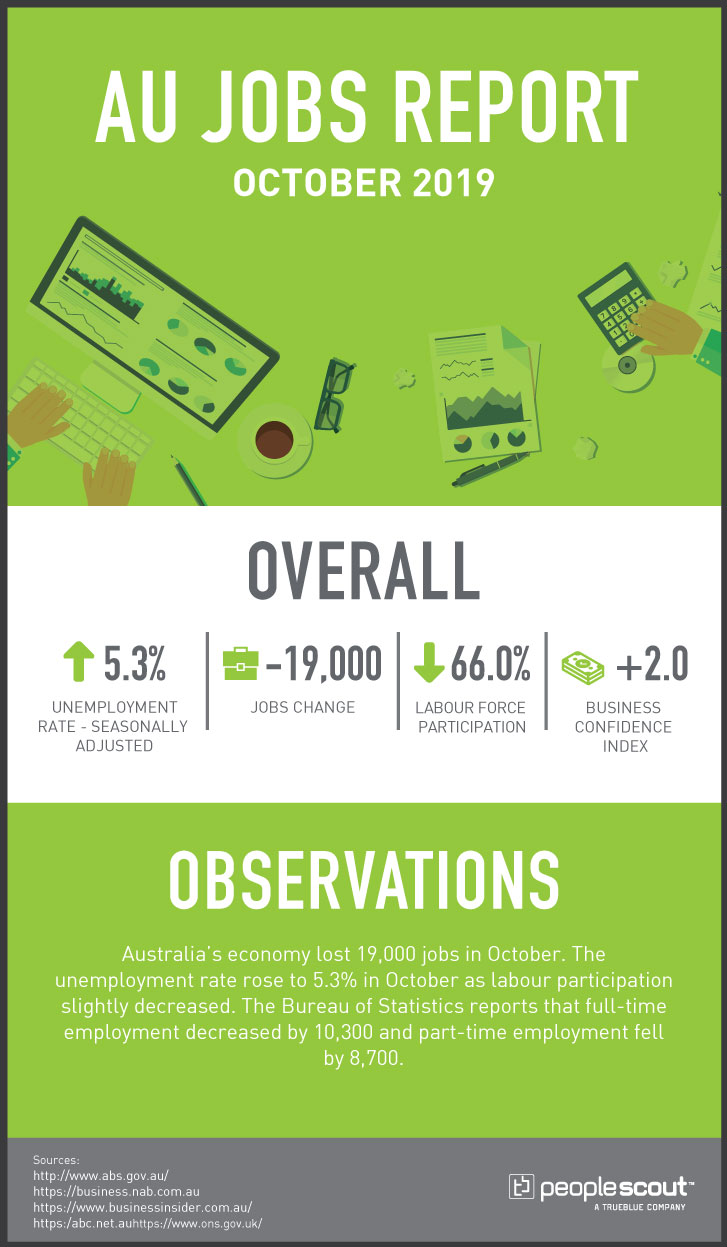
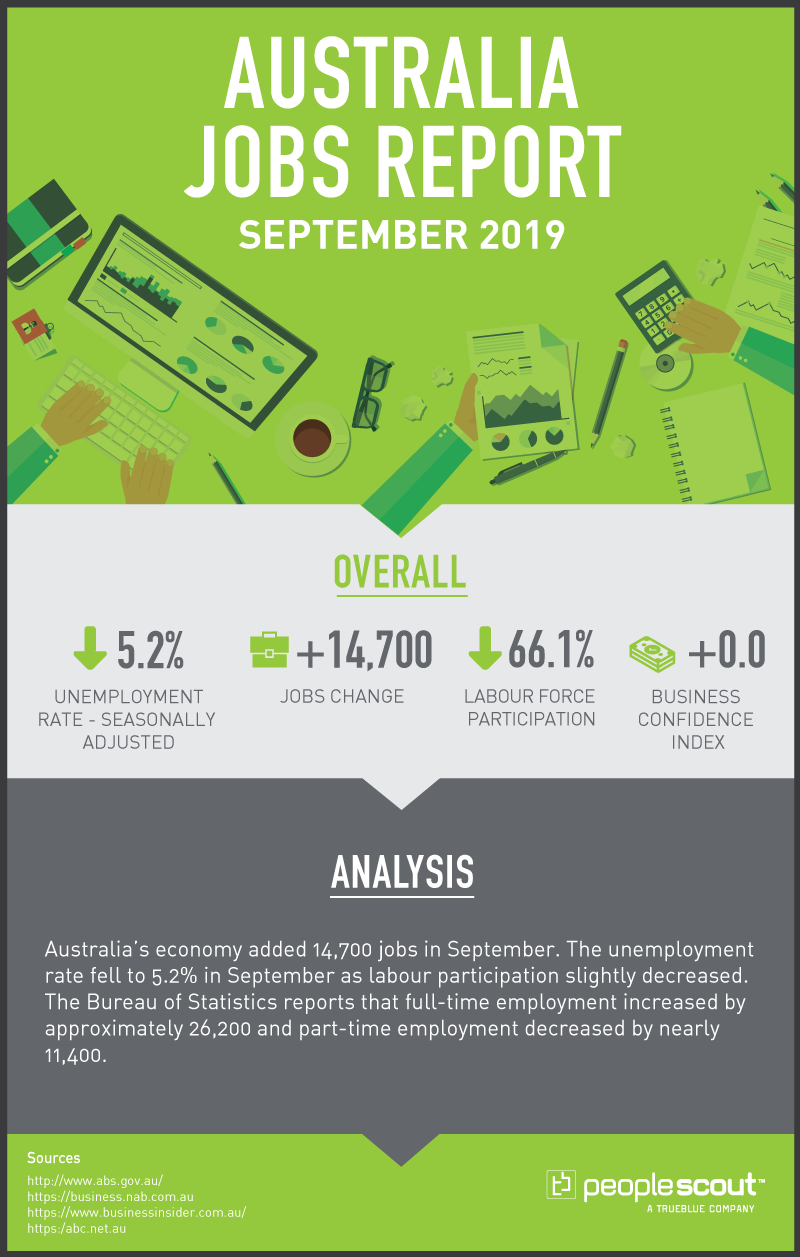
Australia’s economy lost 19,000 jobs in October. The unemployment rate rose to 5.3% in October as labour participation slightly decreased. The Bureau of Statistics reports that full-time employment decreased by 10,300 and part-time employment fell by 8,700.
Numbers
-19,000: The
Australian economy lost 19,000 jobs in October.
5.3%: The Australian unemployment rate rose to 5.3%.
66.0%: Labour
force participation fell to 66.0%.
+2: The Business Confidence
Index rose to +2 in the latest NAB
release.
Upside
When viewed from a year-over-year basis, Australia’s full-time employment increased by 135,700 while part-time employment increased by 116,100. Western Australia had 6,300 job gains and Victoria added 2,900 positions. Western Australia also increased its participation rate by 0.2 percentage points to 68.3%, two percentage points higher than the national rate.
Both business confidence and conditions improved slightly during October. Despite the below-average ratings, NAB Group’s chief economist noted that there has been an uptick in both profitability and trading conditions. He also pointed to their survey which indicated that there would be ongoing employment demand of around 18,000 per month. However, that survey was completed before the release of the October report.
Downside
Australia had its sharpest job decrease in three years in October. The loss in both full-time and part-time employment suggests an overall softening of the job market. Nearly every state lost jobs including Queensland which lost 14,000, New South Wales with a decrease of 10,300 and South Australia which had a drop of 6,500 positions. With only Western Australia and Victoria posting notable job growth in October, the report can be viewed as essentially negative from a national perspective. The job losses were unexpected with some economists expecting a gain of 15,000 positions.
The number of those actively participating in the labour market also dropped, lowering the rate for a second month in a row. The underemployment rate which is a broader measure of joblessness increased by 0.2 percentage points to 8.5%. Seasonally adjusted monthly hours worked in all jobs decreased by 2.8 million hours (or 0.2%) in October.
Low Wage Growth: A Challenge and an Opportunity for Employers
The weak jobs report came just one day after the ABS released its disappointing quarterly wage figures. The wage price index rose by just 0.5% in the quarter ending in September which brought annual growth to a tepid 2.2%. This is the slowest growth level in more than a year and fell short of both the Reserve Bank and federal Treasury expectations.
One implication for Australian employers is that extended periods of low pay raises may lead valued employees to search for work elsewhere.
While there are many factors that lead Australians to look for a new job and find a job offer attractive, at least one study found that salary was the most important:
“When asked what attracted them most to a workplace, the study revealed that salary came out on top, with 30% of Australians listing this at the most important factor when searching for a role.”
The slow wage growth being experienced throughout the country presents employers with both a dilemma and an opportunity. There is decreased competitive pressure to raise salaries and more good candidates may become available. To turn this situation to their advantage, some crucial questions arise. What is the correct wage level to best ensure employee retention? At the same time, what is the ideal pay package to attract talent that at least matches the offers from competitors and contributes to candidate acceptance? And how would a busy HR professional even begin to find the right answers to these questions?
There is useful information available, including data on wage ranges based on position descriptions, markets, education levels, years of experience and other factors. However, this data can be very expensive to purchase and time-consuming to review and interpret. In an economic environment in which many Australians may be motivated to search for their next job opportunity, an outside partner such as a recruitment process outsourcing company (RPO) can provide both the data and the analysis to that leads to solutions resulting in both keeping and attracting the right talent. Those enterprises that leverage both the knowledge and expertise brought by partnering with an RPO will have the tools to navigate a complex talent market and build a successful long-term talent strategy in an uncertain economic environment.